
Telco Domain Knowledge
OSS in the telecom industry is crucial in the evaluation and upkeep of the quality of telecommunications networks and comprises specialist software tools. They are utilized for all operational tasks associated with telecom site administration, including deployment, analysis, monitoring, and configuration.
Network operation team and managers, rollout and build teams, networking planners, application designers, and engineering teams are among the groups that frequently use OSS. Senior executives also use OSS. Although OSS covers a wide range of technical network management procedures, its underlying goal is ensuring the network is effective, services are lucrative, and consumers are satisfied.
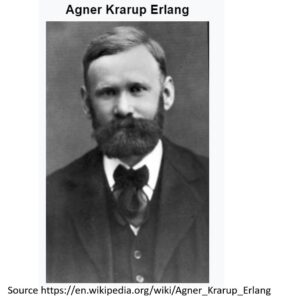
The Erlang B formula was developed by the Danish mathematician Agner Krarup Erlang. He was a pioneer in the field of telecommunication engineering, and his work laid the foundations for many of the techniques and principles that are used in modern communication systems. In addition to the Erlang B formula, he also developed the
Erlang C formula, which is used to calculate the required number of channels in a system to achieve a desired level of service quality.
Overall, Erlang's contributions to the field of telecommunication engineering have had a lasting impact, and his work is still widely used and referenced in the telecom industry today.
The Erlang B theory is a mathematical model used to predict the performance of a telephone switching system or another communication system. It is based on the assumption that calls arrive at a switch or other communication system according to a Poisson process, which is a type of statistical process characterized by a constant arrival rate and a random distribution of interarrival times.
In the telecom industry, the Erlang B theory is used to design and dimension communication systems, as well as to predict their performance and capacity. It is often used in conjunction with the grade of service (GoS), which is a measure of the probability that a call will be blocked due to insufficient resources. The GoS can be calculated using the Erlang B formula, which allows engineers to determine the required number of channels (i.e., available resources) in a system to achieve a desired GoS.
The Erlang B formula is given by:
B = (A^N)/(N! * (N-A)!)
where:
B is the probability of blocking,
A is the traffic intensity in erlangs,
N is the number of channels.
For example, if a system has a desired GoS of 0.2% and a traffic intensity of 10 erlangs, we can use the Erlang B formula to calculate the required number of channels as follows:
B = 0.002 A = 10 erlangs N = ?
Substituting the values into the formula, we get: 0.002 = (10^N)/(N! * (N-10)!)
Solving this equation for N, we find that the required number of channels is approximately 16.7.
Overall, the Erlang B theory is an important tool in the telecom industry for predicting and managing the performance and capacity of communication systems. It is used to ensure that systems are designed to handle the expected levels of traffic and achieve the desired GoS, and identify potential bottlenecks or other issues that may impact their performance.
- Erlangs: In telecommunications, traffic intensity is often measured in units called Erlangs. An Erlang is a unit of traffic intensity that is defined as the product of the average call duration and the average number of calls per unit of time. For example, if a network receives 100 calls per hour, each lasting an average of 10 minutes, the traffic intensity would be 10 Erlangs (100 calls x 10 minutes/call).
- Bits per second: In some contexts, traffic intensity may be measured in terms of the amount of data being transmitted over a network, typically expressed in bits per second (bps). For example, if a network is transmitting 100 megabits per second (Mbps) of data, its traffic intensity would be 100 Mbps.
- Calls per second: In some cases, traffic intensity may be measured in terms of the number of calls being made over a network per unit of time, typically expressed in calls per second (cps). For example, if a network is receiving 10 calls per second, its traffic intensity would be 10 cps.
- Mean holding time: In some contexts, traffic intensity may be defined as the mean holding time of calls or communication sessions on a network, typically expressed in seconds. For example, if the average call duration on a network is 10 minutes, the traffic intensity would be 600 seconds (10 minutes x 60 seconds/minute).
Overall, traffic intensity is a measure of the amount of communication activity taking place on a network, and it can be defined in several different ways depending on the specific context in which it is being used. Mean holding time is one way in which traffic intensity can be defined, and it can be useful for understanding the amount of time that users are spending on calls or other communication sessions on a network.
Traffic intensity and traffic carried are two related but distinct concepts in telecommunication engineering.
Traffic intensity is a measure of the average number of calls or other communication events per channel per unit of time in a communication system. It is typically expressed in units of erlangs, which is defined as the product of the traffic intensity and the total time period over which the traffic is measured.
For example, if a switch handles an average of 10 calls per hour and operates for 8 hours per day, the traffic intensity in erlangs would be 10 * 8 = 80 erlangs.
Traffic carried, on the other hand, is a measure of the total amount of traffic (i.e., calls or other communication events) that is handled by a communication system over a given time period. It is typically expressed in units of erlang-hours, which is defined as the product of the traffic intensity and the time period over which the traffic is measured.
For example, if a switch handles an average of 10 calls per hour and operates for 8 hours per day, the traffic carried in erlang-hours would be 10 * 8 = 80 erlang-hours.
Overall, traffic intensity is a measure of the average load on a communication system, while traffic carried is a measure of the total amount of traffic that the system handles over a given time period. Both concepts are important in the design and dimensioning of communication systems, as they help to determine the required capacity and performance of the system.
In telecommunications, the term "traffic carried" refers to the total volume of data or communication sessions that are transmitted over a network during a given period of time. It is a measure of the amount of communication activity taking place on the network, and it can be used to assess the capacity and performance of the network.
"Mean traffic," on the other hand, refers to the average volume of traffic being transmitted over a network during a given period of time. It is calculated by dividing the total traffic carried by the number of time units over which it was transmitted. For example, if a network carried 1,000 megabits of traffic over a period of 10 hours, its mean traffic would be 100 megabits per hour (1,000 megabits / 10 hours).
Mean traffic is often used as a measure of the average load on a network or system, and it can be useful for understanding the typical traffic patterns on a network over time. It is often used in conjunction with other measures of traffic, such as busy hour traffic and peak traffic, to provide a more complete picture of the traffic patterns on a network.
The Erlang B theory is a mathematical model used to predict the performance of a telephone switching system or other communication system. It is based on the assumption that calls arrive at a switch or other communication system according to a Poisson process, which is a type of statistical process characterized by a constant arrival rate and a random distribution of interarrival times.
The Erlang B theory is used to calculate the probability that a call will be blocked (i.e., unable to be completed due to insufficient resources) as a function of the number of channels (i.e., available resources) in the system, the traffic intensity (i.e., the average number of calls per channel per unit of time), and other factors. This probability is known as the grade of service (GoS), which is a measure of the likelihood that a call will be blocked.
In a telephone switching system, congestion occurs when the number of calls arriving at the system exceeds the number of available channels, resulting in a high GoS and a higher probability of call blocking. When congestion occurs, calls may be queued or dropped, leading to a degradation in the quality of service (QoS) experienced by users.
To avoid congestion and ensure a high QoS, telecom companies must carefully design and dimension their communication systems to ensure that they have sufficient capacity to handle the expected levels of traffic. This can be done using tools such as the Erlang B theory and other traffic engineering techniques.
Overall, the Erlang B theory is an important tool in the telecom industry for predicting and managing the performance and capacity of communication systems, and for minimizing the likelihood of congestion and call blocking. It is used to ensure that systems are designed to handle the expected levels of traffic and to achieve the desired GoS, and to identify potential bottlenecks or other issues that may impact their performance.
The relationship between quality of service (QoS) and system capacity is complex, and it can vary depending on the specific characteristics of a given network or system. In general, however, there is a strong correlation between QoS and system capacity, as the capacity of a system can have a significant impact on its ability to deliver high-quality communication services to users.
As a general rule, increasing the capacity of a system will typically result in an improvement in QoS. For example, if a telecommunications network has a capacity of 100 megabits per second (Mbps) and is transmitting 50 Mbps of traffic, it will generally be able to deliver higher quality communication services to users than if it had a capacity of 50 Mbps and was transmitting 50 Mbps of traffic.
However, it is important to note that simply increasing capacity is not always sufficient to improve QoS, as there are other factors that can also impact the quality of communication services. For example, network congestion, interference, and other external factors can all affect QoS, even if the system has sufficient capacity to handle the traffic.
Overall, there is a strong correlation between QoS and system capacity, and increasing the capacity of a system can generally lead to an improvement in QoS. However, other factors such as network congestion and interference can also impact QoS, and it is important to consider these factors when seeking to optimize the quality of communication services.
The GoS of a network can be calculated using the following formula:
GoS = (Carried traffic / Offered traffic) x 100%
This formula expresses GoS as a percentage, with a higher percentage indicating a better GoS. For example, a GoS of 90% would mean that 90% of the traffic that is attempted to be transmitted over the network is successfully carried, while 10% is lost.
GoS is an important factor to consider in the operation and optimization of a communication network, as it directly affects the user experience and the quality of the services provided. Network administrators can use this formula to monitor GoS and identify strategies for improving it, such as by optimizing the allocation of resources or implementing traffic management techniques.
- Call set-up time: The call set-up time is the amount of time that it takes to establish a connection between two parties for a communication session or call. It includes the time required to initiate the call, negotiate the communication parameters, and establish the connection.
- Conversation time: The conversation time is the amount of time that the two parties spend talking or communicating during a call. It is the duration of the call from the point at which the connection is established until one of the parties disconnects.
- Disconnection time: The disconnection time is the amount of time that it takes to terminate a call or communication session. It includes the time required to release the connection and any other resources used during the call.
- Occupation time: The occupation time is the total amount of time that a communication channel or resource is occupied by a call or communication session. It includes the call set-up time, conversation time, and disconnection time.
As for mean holding time, it is a measure of the average duration of calls or communication sessions on a network. It is calculated by dividing the total holding time of all calls or sessions by the number of calls or sessions. For example, if a network has 10 calls that last a total of 100 minutes, its mean holding time would be 10 minutes (100 minutes / 10 calls). Mean holding time is often used as a measure of traffic intensity in telecommunications, as it helps to understand the amount of time that users are spending on calls or other communication sessions on a network.
- In telecommunications, the term "loss system" refers to a system or network that is designed to handle a certain volume of traffic, but is unable to deliver all of the traffic that is offered to it. This can occur when the volume of traffic exceeds the capacity of the system, resulting in some of the traffic being lost or dropped.Loss systems can be characterized by the probability of loss, which is a measure of the likelihood that a given call or communication session will be lost or dropped due to capacity constraints. The probability of loss is typically expressed as a percentage, and it is calculated by dividing the number of calls or sessions that are lost by the total number of calls or sessions offered to the system.
Loss systems can be contrasted with blocking systems, which are systems that are designed to reject or block any additional traffic once the system reaches capacity. In a blocking system, all calls or communication sessions that are offered to the system beyond its capacity will be blocked or rejected, rather than being lost or dropped.
Overall, loss systems are a common occurrence in telecommunications networks, and they can impact the quality of communication services for users. To mitigate the effects of loss systems, telecommunications providers may use techniques such as traffic engineering and capacity planning to optimize the use of network resources and minimize the probability of loss.
In telecommunications, a delay system is a system or network that is designed to handle a certain volume of traffic, but is unable to deliver it in real time. This can occur when the volume of traffic exceeds the capacity of the system, resulting in delays in the transmission of the traffic.
Delay systems can be characterized by the delay experienced by users, which is a measure of the amount of time that it takes for a given call or communication session to be transmitted over the system. Delay can be caused by a variety of factors, including network congestion, interference, and other capacity constraints.
Delay systems can be contrasted with loss systems, which are systems that are designed to handle a certain volume of traffic but are unable to deliver all of the traffic that is offered to them. In a loss system, some of the traffic is lost or dropped due to capacity constraints, while in a delay system, all of the traffic is transmitted but with a delay.
Overall, delay systems are a common occurrence in telecommunications networks, and they can impact the quality of communication services for users. To mitigate the effects of delay systems, telecommunications providers may use techniques such as traffic engineering and capacity planning to optimize the use of network resources and minimize the delay experienced by users.
Loss systems and delay systems can occur in various types of telecommunications networks and systems, including telephone networks, mobile networks, data networks, and other types of communication systems. They can occur in both wired and wireless networks, and they can be caused by a variety of factors, including network congestion, interference, and other capacity constraints.
Here are a few examples of where loss systems and delay systems may occur today:
- Telephone networks: Loss systems and delay systems can occur in traditional telephone networks, such as those used for landline and VoIP (Voice over Internet Protocol) calls. They can be caused by factors such as network congestion and capacity constraints, and they can impact the quality of communication services for users.
- Mobile networks: Loss systems and delay systems can also occur in mobile networks, such as those used for cellular phone calls and data transmission. They can be caused by factors such as network congestion, interference, and limited capacity, and they can impact the quality of communication services for mobile users.
- Data networks: Loss systems and delay systems can occur in data networks, such as those used for internet connectivity and data transmission. They can be caused by factors such as network congestion, limited capacity, and interference, and they can impact the performance and reliability of data transmission.
Overall, loss systems and delay systems can occur in a variety of telecommunications networks and systems, and they can impact the quality and performance of communication services for users. Telecommunications providers use various techniques and strategies to minimize the occurrence of loss systems and delay systems, and to ensure that networks are able to deliver high-quality communication services to users.
Yes, subscriber behaviour is an important factor to consider in telecommunications, as it can have a significant impact on the performance and capacity of a network. The way in which subscribers react to unsuccessful call attempts, such as by making a new attempt, can affect the volume of traffic on the network and the probability of loss or delay.
In general, if subscribers react to unsuccessful call attempts by making a new attempt, it can increase the volume of traffic on the network and potentially lead to more instances of loss or delay. This is because each new call attempt consumes additional network resources, and if the volume of traffic exceeds the capacity of the network, it can result in lost or delayed calls.
To mitigate the impact of subscriber behaviour on the performance and capacity of a network, telecommunications providers may use various techniques, such as traffic engineering and capacity planning, to optimize the use of network resources and ensure that the network is able to handle the expected volume of traffic effectively. They may also implement strategies such as network congestion control algorithms to manage the flow of traffic and minimize the probability of loss or delay.
Erlang's first formula, also known as Erlang's loss formula, can be used to calculate the probability of congestion in a loss system, given the volume of traffic offered to the system in Erlangs. The formula is as follows:
Probability of congestion = (Traffic offered in Erlangs) / (Capacity in Erlangs)
For example, if a network has a capacity of 10 Erlangs and is being offered a traffic volume of 15 Erlangs, the probability of congestion would be calculated as follows:
Probability of congestion = (15 Erlangs) / (10 Erlangs) = 1.5
This indicates that there is a 1.5 times greater probability of congestion occurring on the network due to the volume of traffic being offered exceeding the capacity of the network.
Erlang's second formula, also known as Erlang's delay formula, can be used to calculate the probability of delay in a delay system, given the volume of traffic offered to the system in Erlangs. The formula is as follows:
Probability of delay = (Traffic offered in Erlangs)^2 / (2 Capacity in Erlangs (Capacity in Erlangs - Traffic offered in Erlangs))
For example, if a network has a capacity of 10 Erlangs and is being offered a traffic volume of 15 Erlangs, the probability of delay would be calculated as follows:
Probability of delay = (15 Erlangs)^2 / (2 10 Erlangs (10 Erlangs - 15 Erlangs)) = 225 / (2 10 (-5)) = 225 / (-100) = -2.25
This indicates that there is a 2.25 times greater probability of delay occurring on the network due to the volume of traffic being offered exceeding the capacity of the network.
It's important to note that both Erlang's first and second formulas are based on assumptions about the behaviour of traffic in loss and delay systems, and they may not always provide accurate results in all cases. In practice, it may be necessary to use more advanced tools and techniques to accurately model and analyse the performance of loss and delay systems.
Understanding LTE's Physical Resource Block (PRB)
LTE is a widely used cellular technology that provides high-speed data services to mobile devices. One of the key components of LTE is the physical resource block (PRB). In this article, we will explore the basics of PRBs, their characteristics, and their importance in the LTE network.

Fig 1 from articacl: CTMC modeling for M2M/H2H coexistence in a NB-IoT Adaptive eNodeB
What is a Physical Resource Block (PRB)?
A PRB is a basic unit of frequency and time resources in LTE networks. It is a fixed-size channel that can be allocated to a user to transmit or receive data. Each PRB has a bandwidth of 180 kHz and a duration of 1 millisecond. The number of PRBs allocated to a user depends on the required data rate and available network resources.
Terminology
When discussing an LTE Frame, it's important to understand some of the terms used to describe it. The unit of time is broken into six parts: frame, half-frame, subframe, slot, symbol and Ts which is the smallest unit of time.
Time Unit Value
Frame 10 ms
Half-frame 5 ms
Subframe 1 ms
Slot 0.5 ms
Symbol (0.5 ms) / 7 for normal CP
(0.5 ms) / 6 for extended CP
Ts 1/(15000 * 2048) sec » 32.6 ns
Below is an illustration of an FDD frame.
Frequency units can be measured by the number of subcarriers or resource blocks. For example, a 5MHz downlink signal may be described as 25 resource blocks or 301 subcarriers wide (not including the DC subcarrier in a resource block).
An LTE frame is composed of Resource Elements (REs), which are the smallest parts, 1 subcarrier by 1 symbol in size. These REs contain a single complex value for each physical channel or signal, representing relevant data.
Bandwidths
According to the standard, the available bandwidths are 1.4, 3, 5, 10, 15 and 20 MHz. The below table illustrates how many subcarriers & resource blocks each of these specifications contain for both uplink & downlink.
Bandwidth Resource Blocks Subcarriers (downlink) Subcarriers (uplink)
1.4 MHz 6 73 72
3 MHz 15 181 180
805 MHz 25 301 300
10 MHz 50 601 600
15 MHz 75 901 900
20 MHz 100 1201 1200
The Importance of PRBs
The allocation of PRBs is a critical factor in determining the data transmission rate and the quality of service for the user. In LTE, the maximum number of PRBs that can be allocated to a user is 100, which corresponds to a total bandwidth of 20 MHz. This means that a user can transmit or receive up to a certain amount of data within a given time frame, depending on how many PRBs are allocated to them.
PRBs are also important for the efficient use of network resources. By dynamically allocating PRBs to users, the network can optimize the utilization of its resources and maximize the number of users that can be served simultaneously.
PRB Allocation
PRBs are allocated based on the quality of service (QoS) requirements and available network resources. The allocation process is controlled by the eNodeB, which is the base station in the LTE network. The eNodeB uses scheduling algorithms to determine the allocation of PRBs to users based on their QoS requirements, traffic demand, and network conditions. The allocation of PRBs is a critical factor in determining the data transmission rate and the quality of service for the user. The number of PRBs allocated to a user depends on the required data rate and available network resources. In LTE, the maximum number of PRBs that can be allocated to a user is 100, which corresponds to a total bandwidth of 20 MHz.
PRBs are also important for the efficient use of network resources. By dynamically allocating PRBs to users based on QoS requirements and network conditions, the network can optimize the utilization of its resources and serve a large number of users.
To calculate the amount of PRBs needed to transmit data at a specific data rate, the following formula can be used:
PRBs = (Data Rate × Transmission Time) / (Number of Bits per PRB × PRB Bandwidth)
For example, if we want to transmit data at a rate of 10 Mbps for 1 second using LTE, we can calculate the number of PRBs required as follows:
PRBs = (10 × 10^6 × 1) / (12 × 10^3 × 180 × 10^3) = 4.63
This means that we would need to allocate at least 5 PRBs to achieve a data rate of 10 Mbps for 1 second.
Masuere and Monitoring PRB is Vital
By monitoring and measuring the utilization rate of the element during peak hours, network operators can identify areas where the network may be experiencing congestion or other capacity-related issues. In order to timely detect and notify any anomalies that may occur in the network, TTG's PM solution NORTH-I constantly monitors PRBs and other important metrics and KPIs and automatically reviews them for you. This can help them optimize network resources, adjust network configurations, and improve the overall quality of the user experience during periods of high usage.Let's reinforce what we said with an example.
Let's say that a particular network element in a mobile network has a theoretical traffic capacity of 100 Mbps, based on its current PRB capacity. However, historical traffic data shows that on average, the element only carries 80 Mbps of traffic during peak hours.
To calculate when the element will fill its capacity, we can first determine the utilization rate of the element during peak hours, which is:
Utilization rate = (80 Mbps / 100 Mbps) x 100% = 80%
Next, we can use this utilization rate to estimate how long it will take for the element to reach full capacity, assuming traffic levels remain consistent:
Time to full capacity = (100% - 80%) x (24 hours/day) = 4.8 hours
This calculation suggests that during peak hours, the network element will reach its full capacity within 4.8 hours if traffic levels remain consistent. This information can help network operators plan for capacity upgrades or other measures to optimize network performance during high-traffic periods.
Conclusion
In summary, PRBs are a fundamental building block of LTE networks, providing a fixed-size channel that can be allocated to a user for data transmission. The number of PRBs allocated to a user determines the data transmission rate and the quality of service. By dynamically allocating PRBs based on QoS requirements and network conditions, the network can maximize its resource utilization and efficiently serve a large number of users.